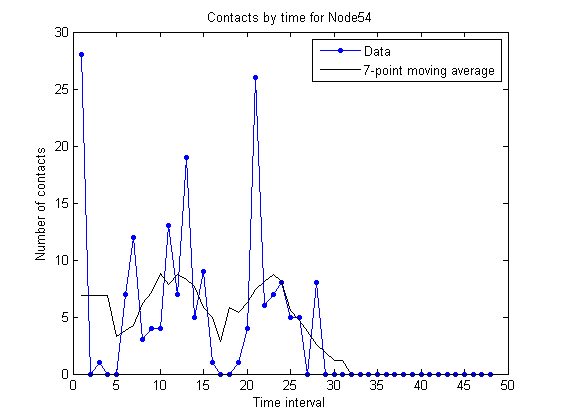
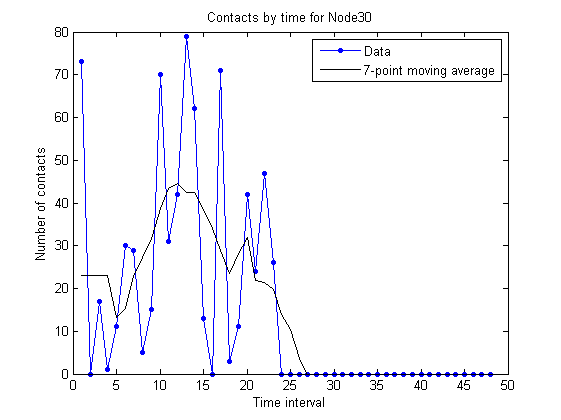
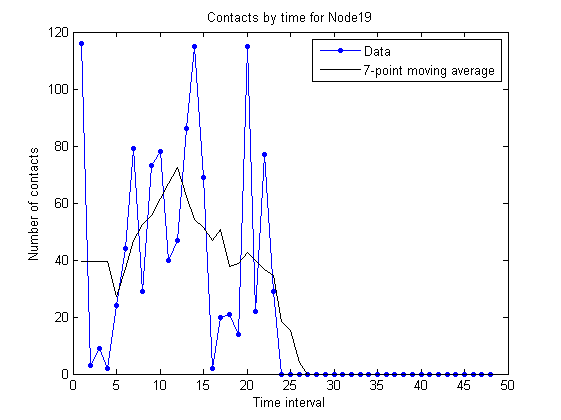
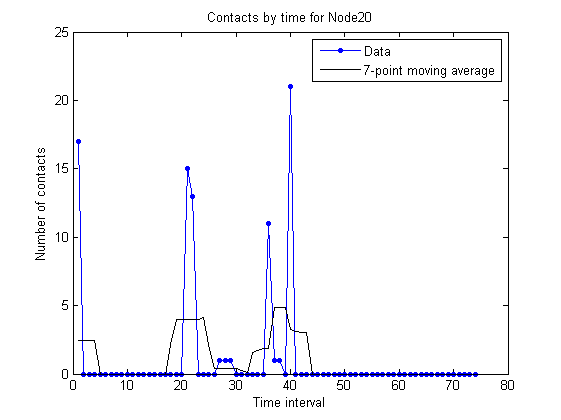
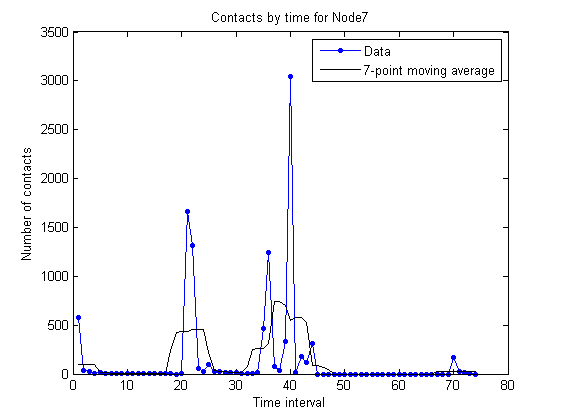
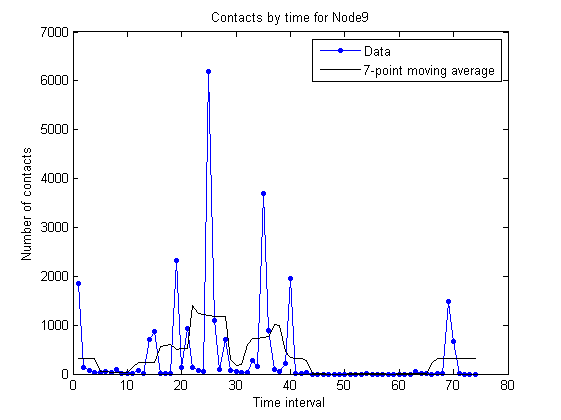
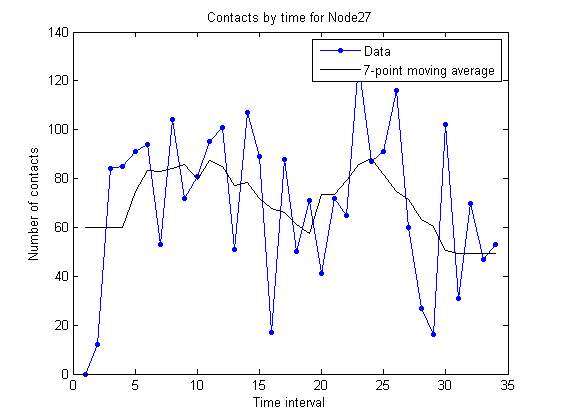
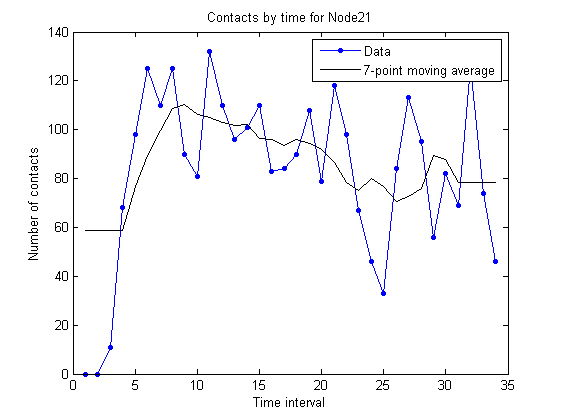
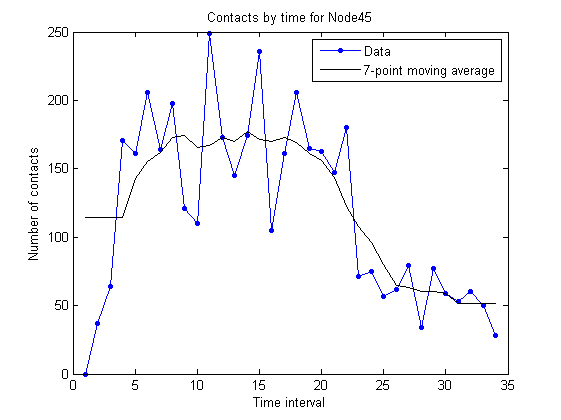
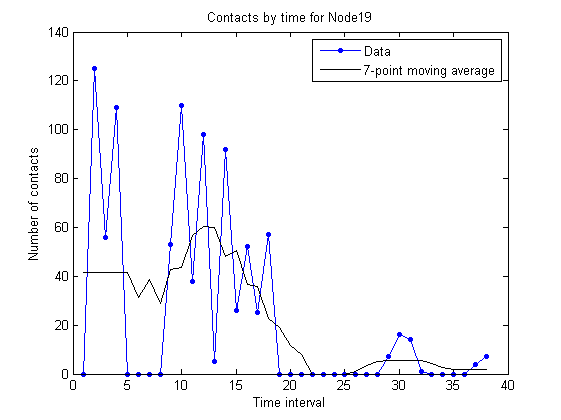
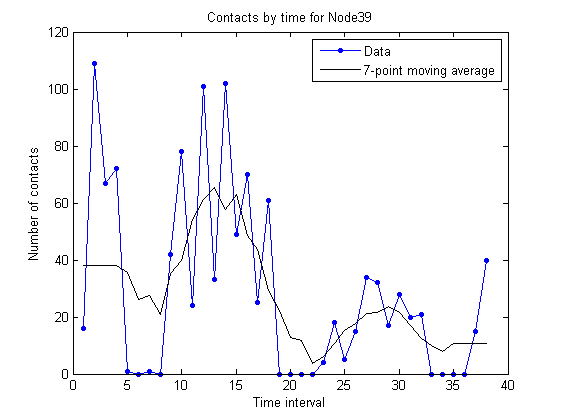
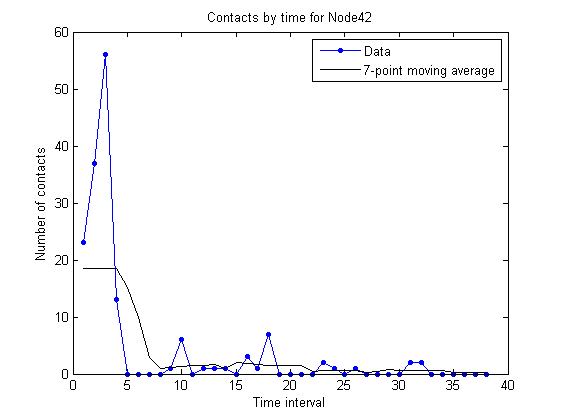
We have also generated time series plots for individual nodes, rather than for the whole population. We have chosen 3 different nodes for each dataset, with high, medium and low amount of contacts. unimi/pmtr:    upmc/rollernet:    st_andrews/sassy:    upmc/content:    |