|
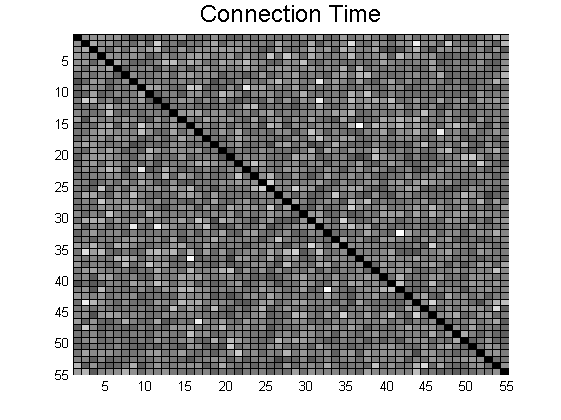
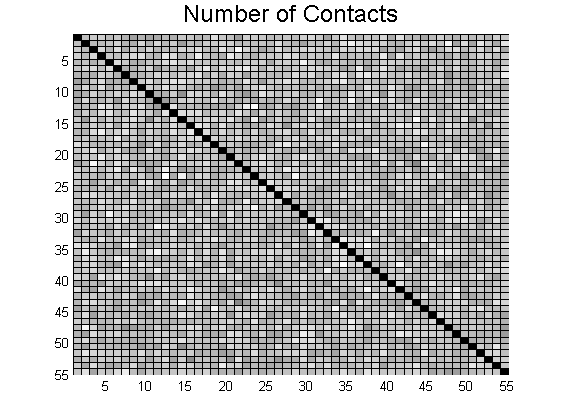
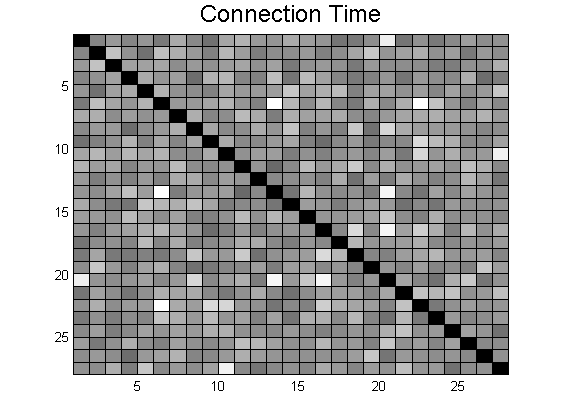
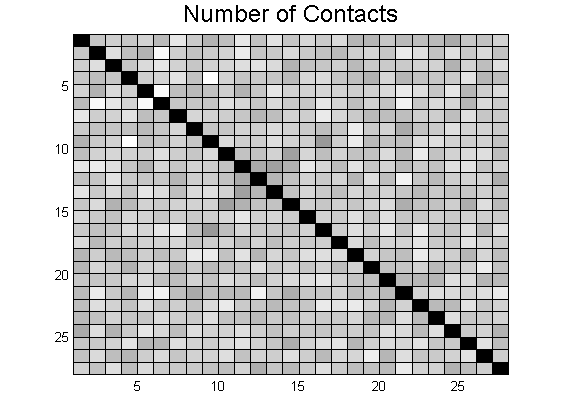
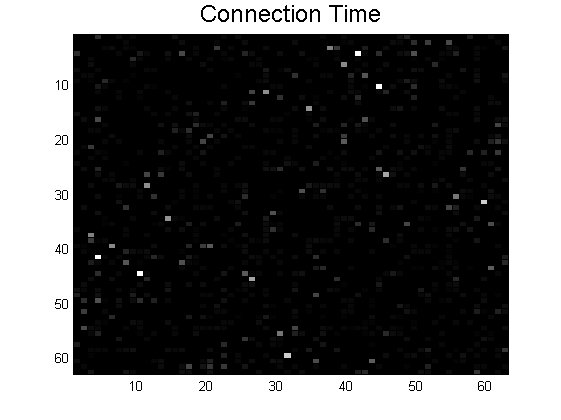
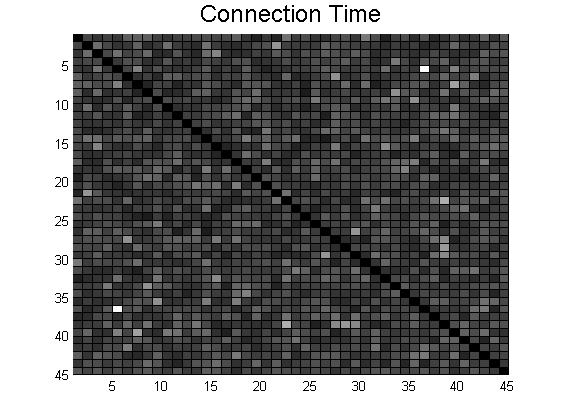
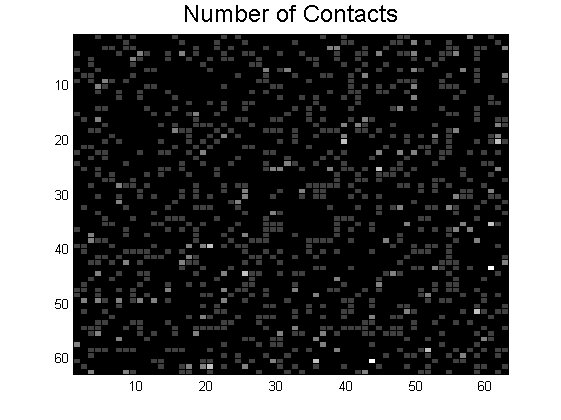
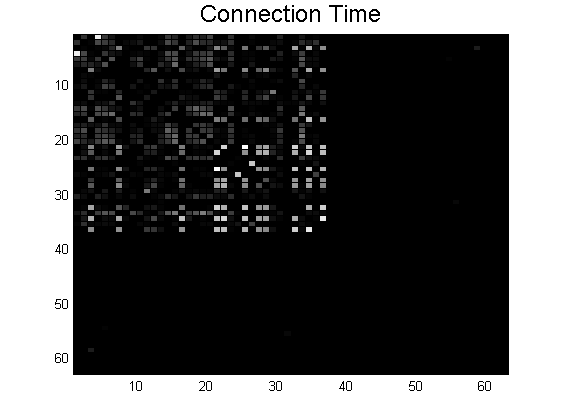
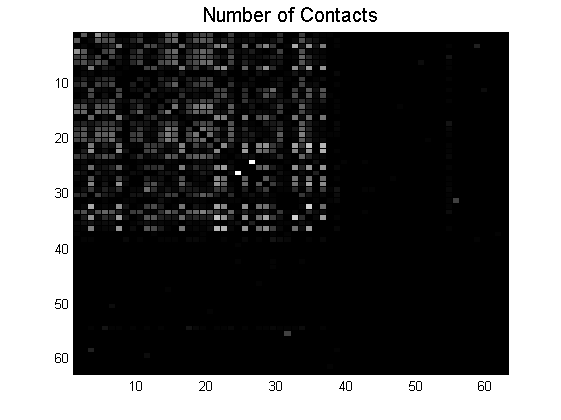
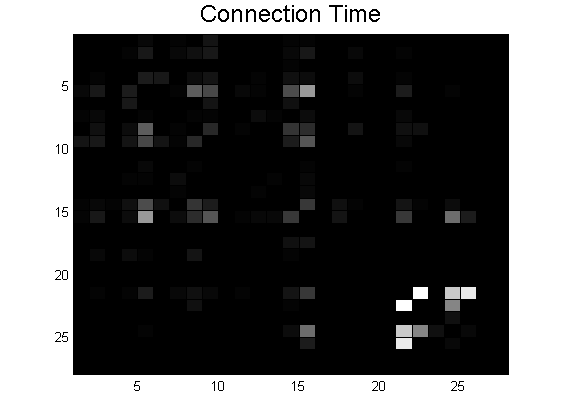
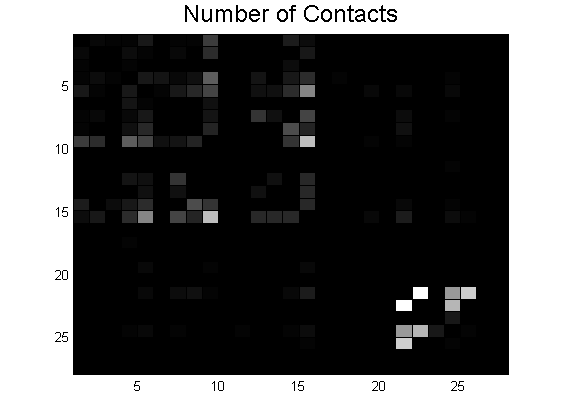
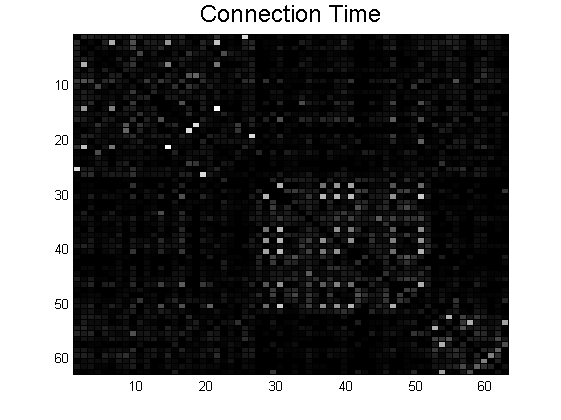
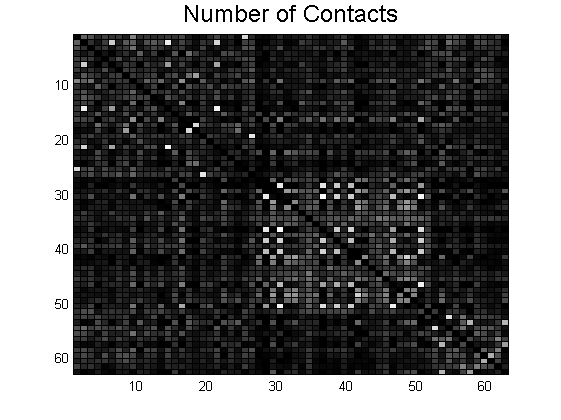
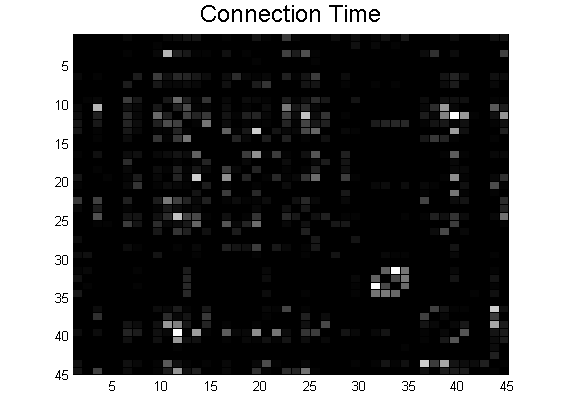
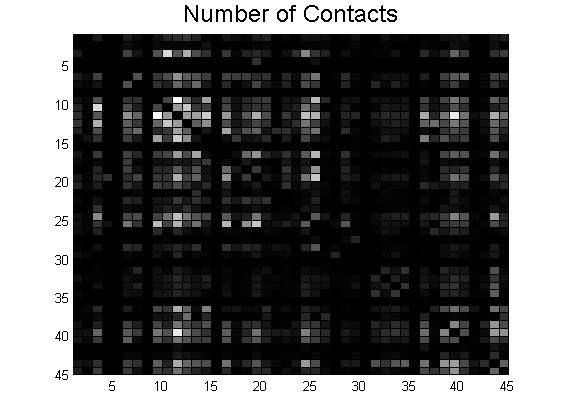
This page displays the generated heatmaps for each dataset.
Each cell represents the number or duration of contacts between each pair of nodes. The lightest cells indicate the pair with the highest number of contacts (or most duration) and vice versa. Since we consider the contacts to be bidirectional, the heatmaps are symmetric. unimi/pmtr:   unimi/pmtr simulation: 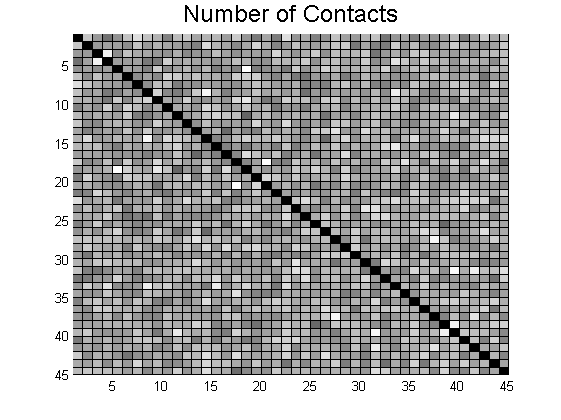  upmc/rollernet:   upmc/rollernet simulation:   st_andrews/sassy:   st_andrews/sassy simulation:   upmc/content:   upmc/content simulation:   |