|
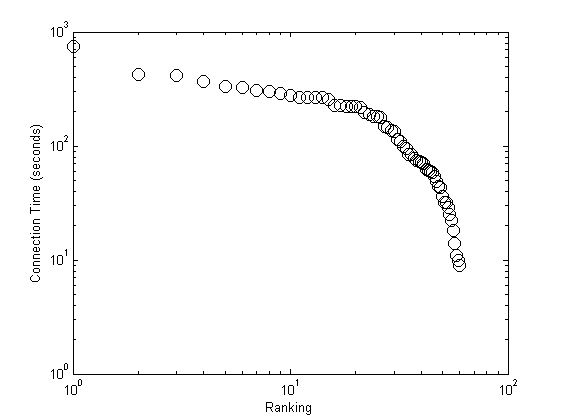
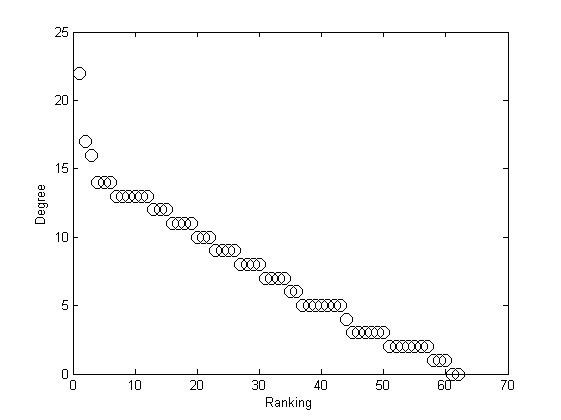
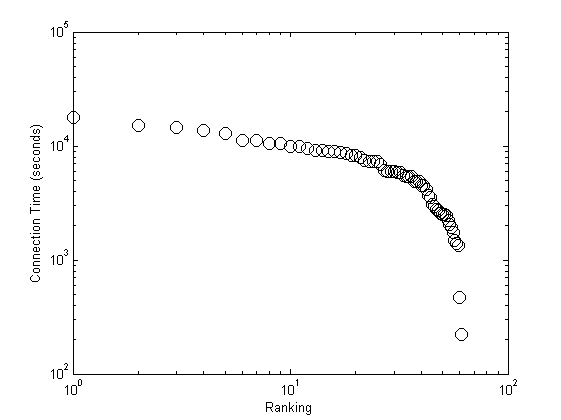
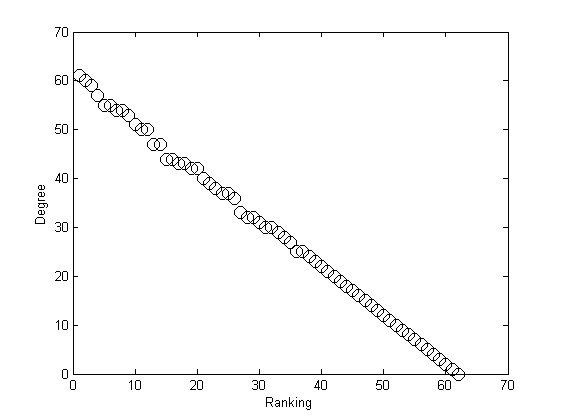
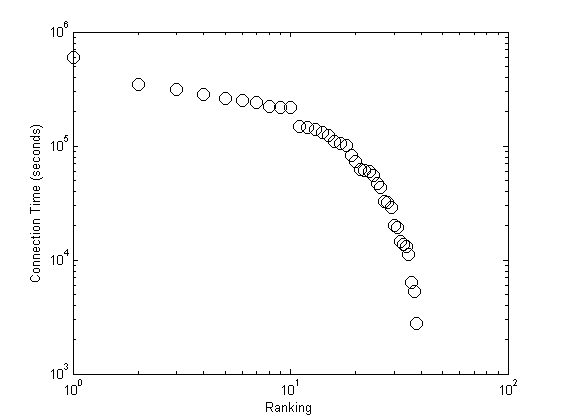
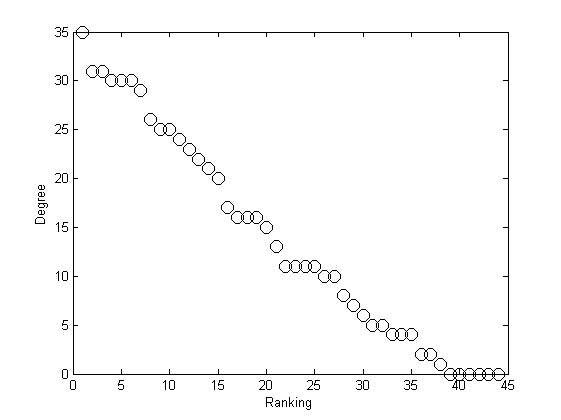
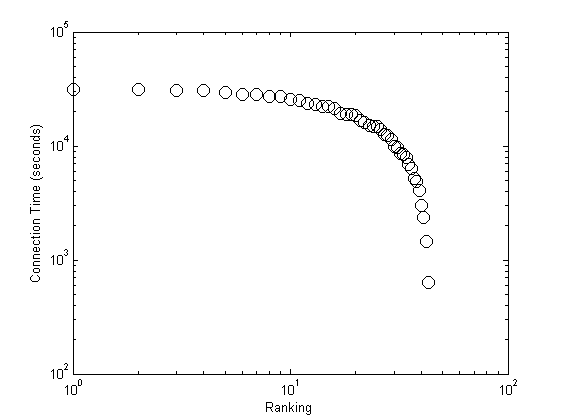
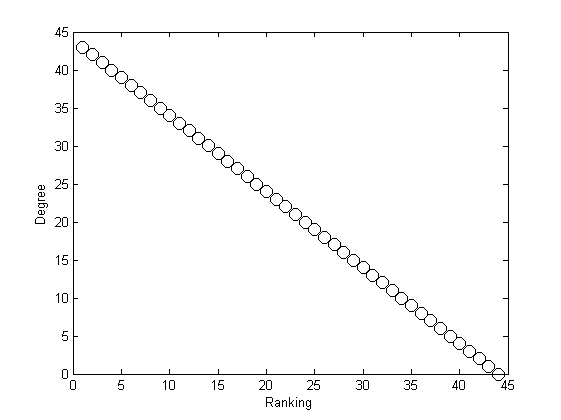
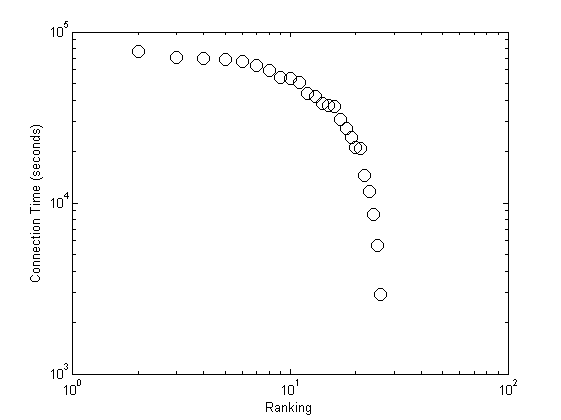
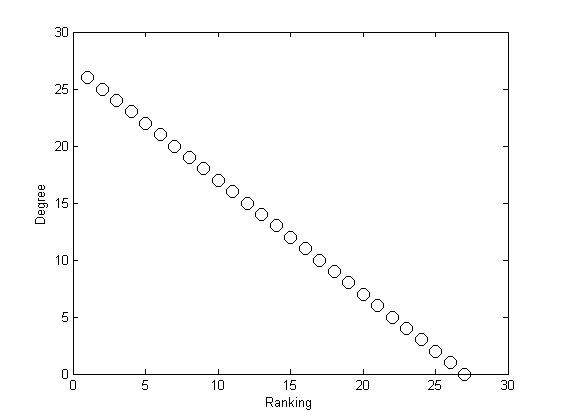
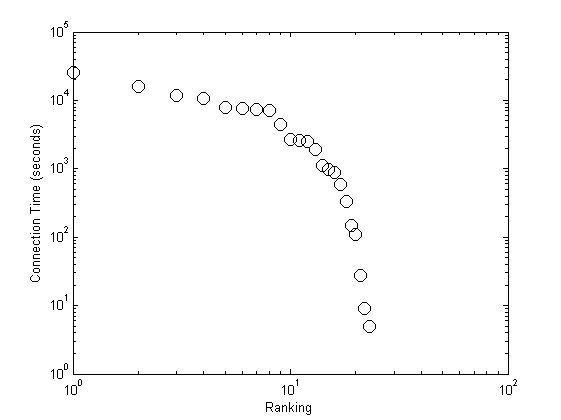
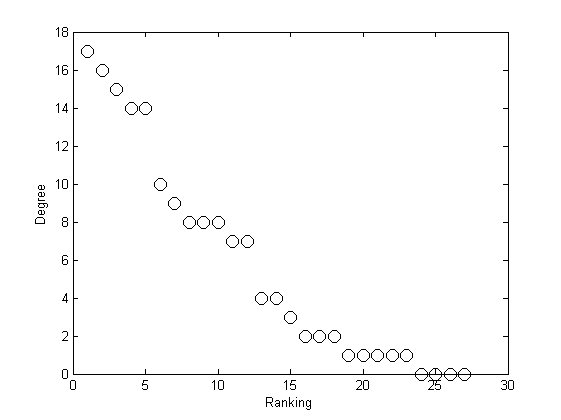
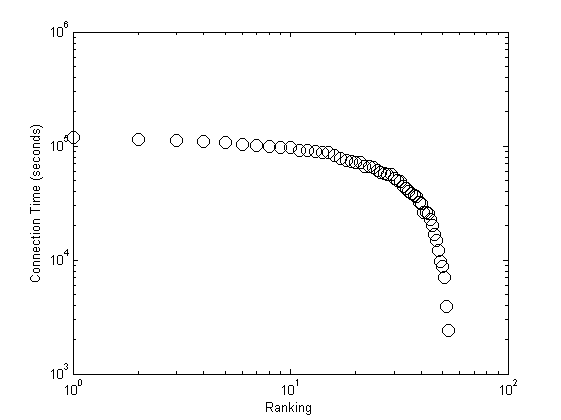
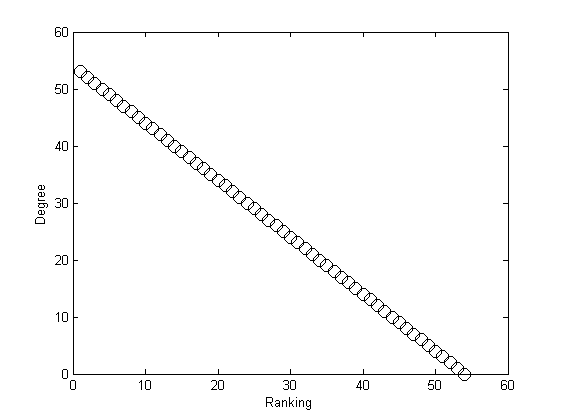
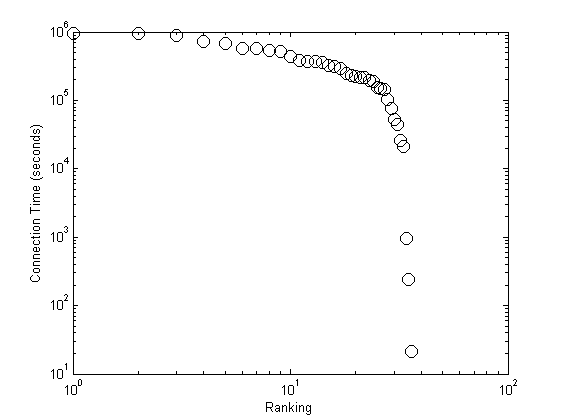
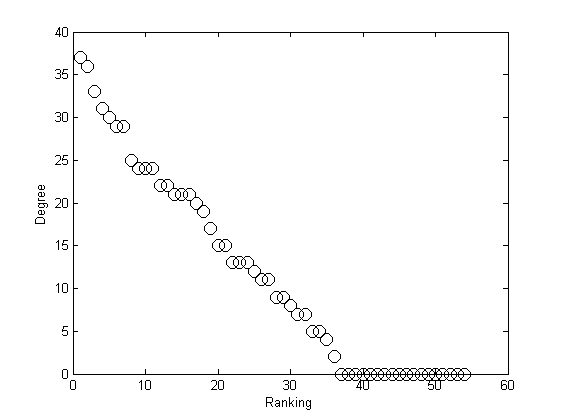
This page presents the node ranking plots for the
referenced datasets.
These plots order the nodes in terms of highest to lowest degree (the number of different nodes contacted) and connection time. unimi/pmtr:   unimi/pmtr simulation:   upmc/rollernet:   upmc/rollernet simulation:   st_andrews/sassy:   st_andrews/sassy simulation:   upmc/content:   upmc/content simulation:   |